Performance Counters and Threshold for Exchange Server
We'll continue Exchange Monitoring and now delve into one of the most important topics of Performance Monitoring. In this post we'll discuss about the various Performance Counters and their Thresholds that should be kept in mind when performing a Cumulative HealthCheck.
Please Note: Some changes might be noticed with different versions of Exchange Server
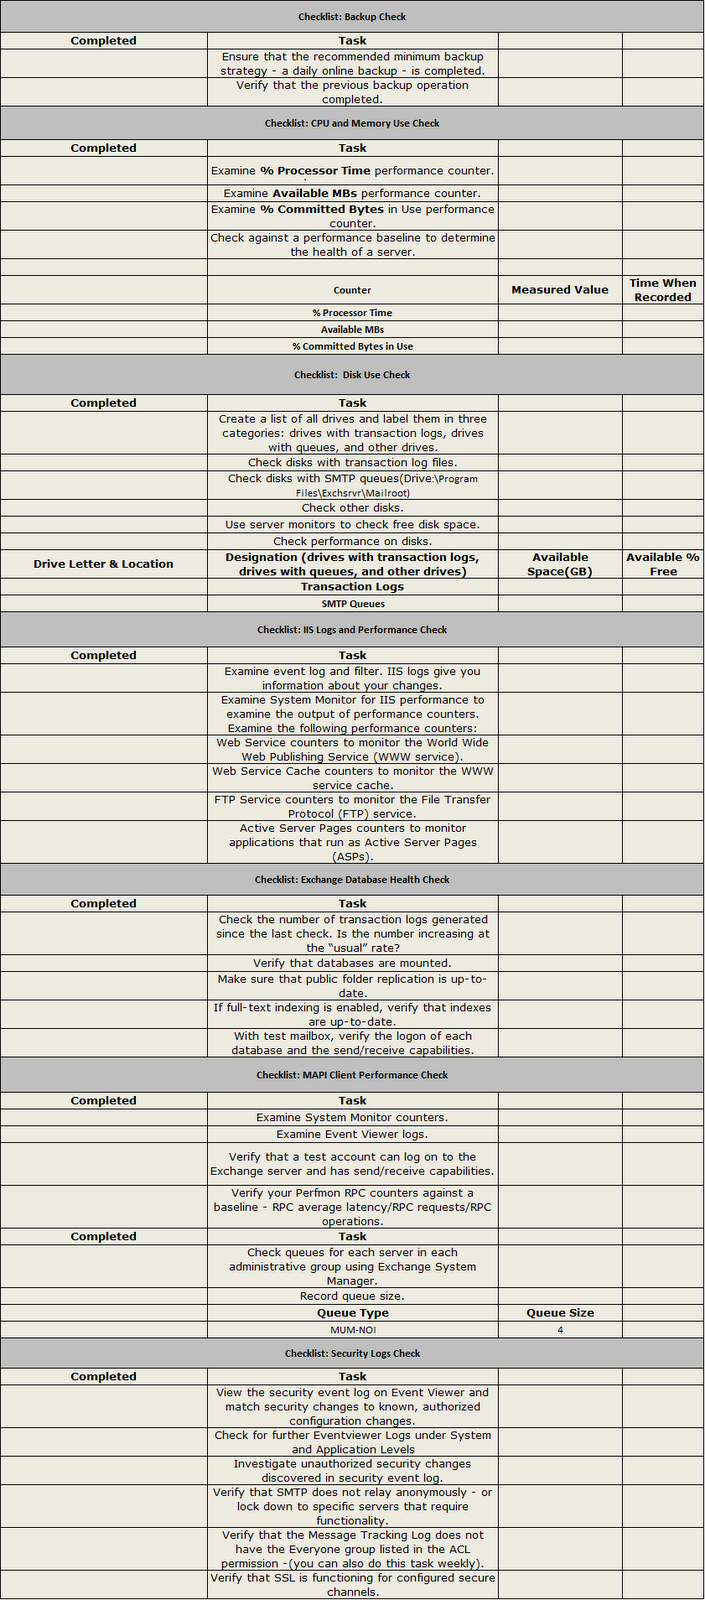
Every Checklist thats circulated among team members should have these Thresholds mentioned clearly for reference.
Please Note: Some changes might be noticed with different versions of Exchange Server
Type
|
Object\Counter
|
Threshold
|
Action
|
Memory
|
Memory\Available Bytes
|
Less than 4MB
|
Check for memory leaks and add RAM if necessary
|
Memory
|
Memory\Pages/ sec
|
20
|
Investigate paging settings
|
Paging File
|
Paging File\% Usage
|
Above 70%
|
The Paging File value should match up with the previous two
values. A value exceeding 70% is not healthy for the system.
|
Disk
|
Physical Disk\ Free Space
Logical Disk\
Free Space
|
15%
|
Clear more disk space. Increase logical or physical disk
space
|
Disk
|
Physical Disk\ Disk Time
Logical Disk\ Disk Time
|
90%
|
The disk is not being read quickly enough. This could be a
hardware issue. It could also be that the amount of data on disk is too
large.
|
Disk
|
Physical Disk\Disk Reads/sec, Physical Disk\Disk Writes/sec
|
Depends on Manufacturer
|
The writing the reading from the disk is slow. We may need to
upgrade the disk or disk drivers
|
Processor
|
Processor\ % Processor Time
|
85%
|
Find the process intensive processes and move them to
separate processors (if you have a multi-processor machine) or add more
processing power (by adding another processor or by upgrading to a faster
processor)
|
Processor
|
Processor\ Interrupts/ sec
|
Processor specific; 1000 is a standard
|
If the counter value increases without additional processes,
the cause could be hardware related
|
Server
|
Server\ Bytes Total/ sec
|
Depends on the network
|
If all your servers’ Bytes Total/ sec is the same and similar
to the maximum network speed, you might need to increase the network
bandwidth
|
Server
|
Server\ Pool Paged Peak
|
Physical RAM available
|
Should not be greater than the physical RAM value.
|
Performance Object
|
Performance Counter
|
Details
|
MSExchangeIS
|
VM Largest Block Size
|
A healthy server has more than 200,000,000 bytes
(200 MB) as the largest free block. If the value is lower, carefully
monitor the server.
|
Memory
|
Pool Page Bytes
|
When the /3GB switch is used, amounts larger than 200 MB
indicate a problem except when backups are running. During backups, each page
in the cache manager is copied into the pool page, which causes an increase
in pool page size.
|
Memory
|
Pool Nonpaged Bytes
|
When the /3GB switch is used, amounts larger than 100 MB
indicate a problem.
|
Memory
|
Free System Page Table Entries
|
Amounts less than 3000 indicate a problem.
|
Process
|
Private Bytes
|
An upward trend indicates a potential memory leak.
|
Every Checklist thats circulated among team members should have these Thresholds mentioned clearly for reference.
I always felt that, even although the care workers wore plastic hygiene gloves, the less preparation of food they had to do, the better. NDIS Providers Kingscliff
ReplyDelete